Google Spreadsheet to HTML - Variant with JS Function
Published 2 years ago
Created by

Tom

Categories
Template description
This workflow shows a low code approach to creating a HTML table based on Google Sheets data. It's similar to this workflow, but allows fully customizing the HTML output.
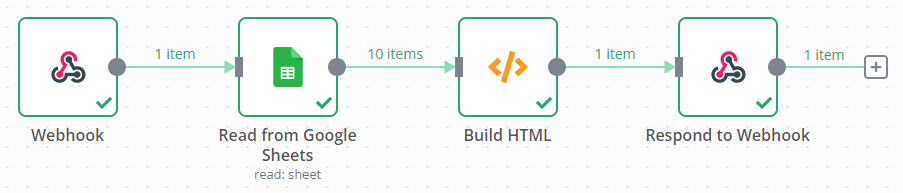
To run the workflow:
- Make sure you have a Google Sheet with a header row and some data in it.
- Grab your sheet ID:
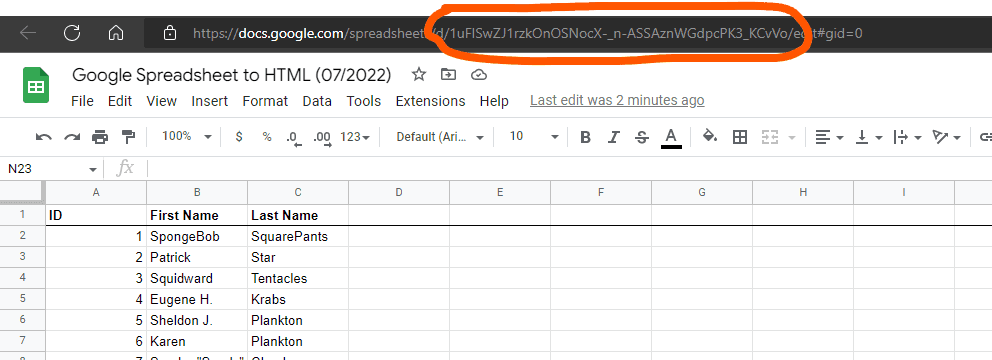
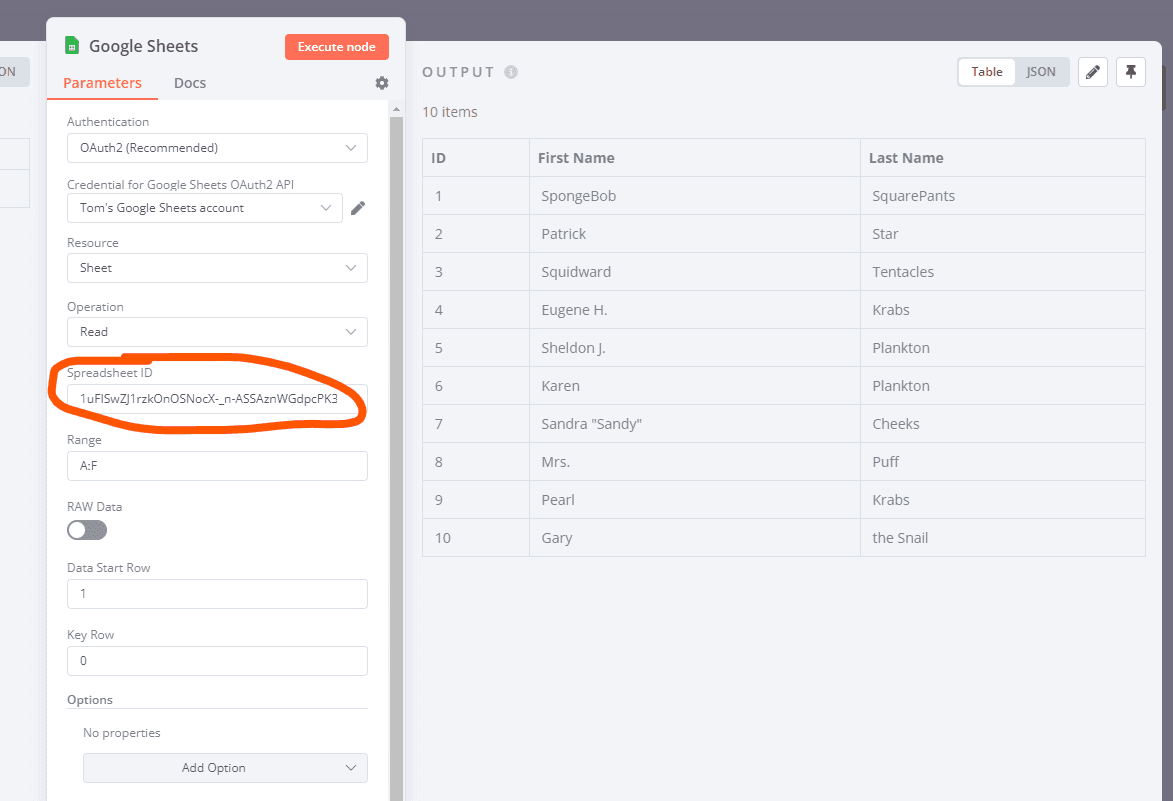
- Add it to the Google Sheets node:
- Activate the workflow or execute it manually
- Visit the URL provided by the webhook node in your browser (production URL if the workflow is active, test URL if the workflow is executed manually)
Share Template
More Building Blocks workflow templates
Creating an API endpoint
Task:
Create a simple API endpoint using the Webhook and Respond to Webhook nodes
Why:
You can prototype or replace a backend process with a single workflow
Main use cases:
Replace backend logic with a workflow

Jonathan

Very quick quickstart
Want to learn the basics of n8n? Our comprehensive quick quickstart tutorial is here to guide you through the basics of n8n, step by step.
Designed with beginners in mind, this tutorial provides a hands-on approach to learning n8n's basic functionalities.

Deborah


+10
Building Your First WhatsApp Chatbot
This n8n template builds a simple WhatsApp chabot acting as a Sales Agent. The Agent is backed by a product catalog vector store to better answer user's questions.
This template is intended to help introduce n8n users interested in building with WhatsApp.
How it works
This template is in 2 parts: creating the product catalog vector store and building the WhatsApp AI chatbot.
A product brochure is imported via HTTP request node and its text contents extracted.
The text contents are then uploaded to the in-memory vector store to build a knowledgebase for the chatbot.
A WhatsApp trigger is used to capture messages from customers where non-text messages are filtered out.
The customer's message is sent to the AI Agent which queries the product catalogue using the vector store tool.
The Agent's response is sent back to the user via the WhatsApp node.
How to use
Once you've setup and configured your WhatsApp account and credentials
First, populate the vector store by clicking the "Test Workflow" button.
Next, activate the workflow to enable the WhatsApp chatbot.
Message your designated WhatsApp number and you should receive a message from the AI sales agent.
Tweak datasource and behaviour as required.
Requirements
WhatsApp Business Account
OpenAI for LLM
Customising this workflow
Upgrade the vector store to Qdrant for persistance and production use-cases.
Handle different WhatsApp message types for a more rich and engaging experience for customers.

Jimleuk

Pulling data from services that n8n doesn’t have a pre-built integration for
You still can use the app in a workflow even if we don’t have a node for that or the existing operation for that. With the HTTP Request node, it is possible to call any API point and use the incoming data in your workflow
Main use cases:
Connect with apps and services that n8n doesn’t have integration with
Web scraping
How it works
This workflow can be divided into three branches, each serving a distinct purpose:
1.Splitting into Items (HTTP Request - Get Mock Albums):
The workflow initiates with a manual trigger (On clicking 'execute').
It performs an HTTP request to retrieve mock albums data from "https://jsonplaceholder.typicode.com/albums."
The obtained data is split into items using the Item Lists node, facilitating easier management.
2.Data Scraping (HTTP Request - Get Wikipedia Page and HTML Extract):
Another branch of the workflow involves fetching a random Wikipedia page using an HTTP request to "https://en.wikipedia.org/wiki/Special:Random."
The HTML Extract node extracts the article title from the fetched Wikipedia page.
3.Handling Pagination (The final branch deals with handling pagination for a GitHub API request):
It sends an HTTP request to "https://api.github.com/users/that-one-tom/starred," with parameters like the page number and items per page dynamically set by the Set node.
The workflow uses conditions (If - Are we finished?) to check if there are more pages to retrieve and increments the page number accordingly (Set - Increment Page).
This process repeats until all pages are fetched, allowing for comprehensive data retrieval.
Jonathan

Joining different datasets
Task:
Merge two datasets into one based on matching rules
Why:
A powerful capability of n8n is to easily branch out the workflow in order to process different datasets. Even more powerful is the ability to join them back together with SQL-like joining logic.
Main use cases:
Appending data sets
Keep only new items
Keep only existing items
Jonathan

+11
Back Up Your n8n Workflows To Github
This workflow will backup your workflows to Github. It uses the public api to export all of the workflow data using the n8n node.
It then loops over the data checks in Github to see if a file exists that uses the workflow name. Once checked it will then update the file on Github if it exists, Create a new file if it doesn't exist and if it's the same it will ignore the file.
Config Options
repo_owner - Github owner
repo_name - Github repository name
repo_path - Path within the Github repository
>This workflow has been updated to use the n8n node and the code node so requires at least version 0.198.0 of n8n
Jonathan